01:00
Bootstrapping
While you’re waiting
If you’ve been given an index card, please write on it:
- Your first name
- Your year at Cal (1 is first year, 2 is second year, etc)
- Whether or not you are interested in majoring in a business- or econ-related field. 1 = yes, 0 = no
Agenda
- Concept Question
- Activity: The Bootstrap
- PS: The Bootstrap
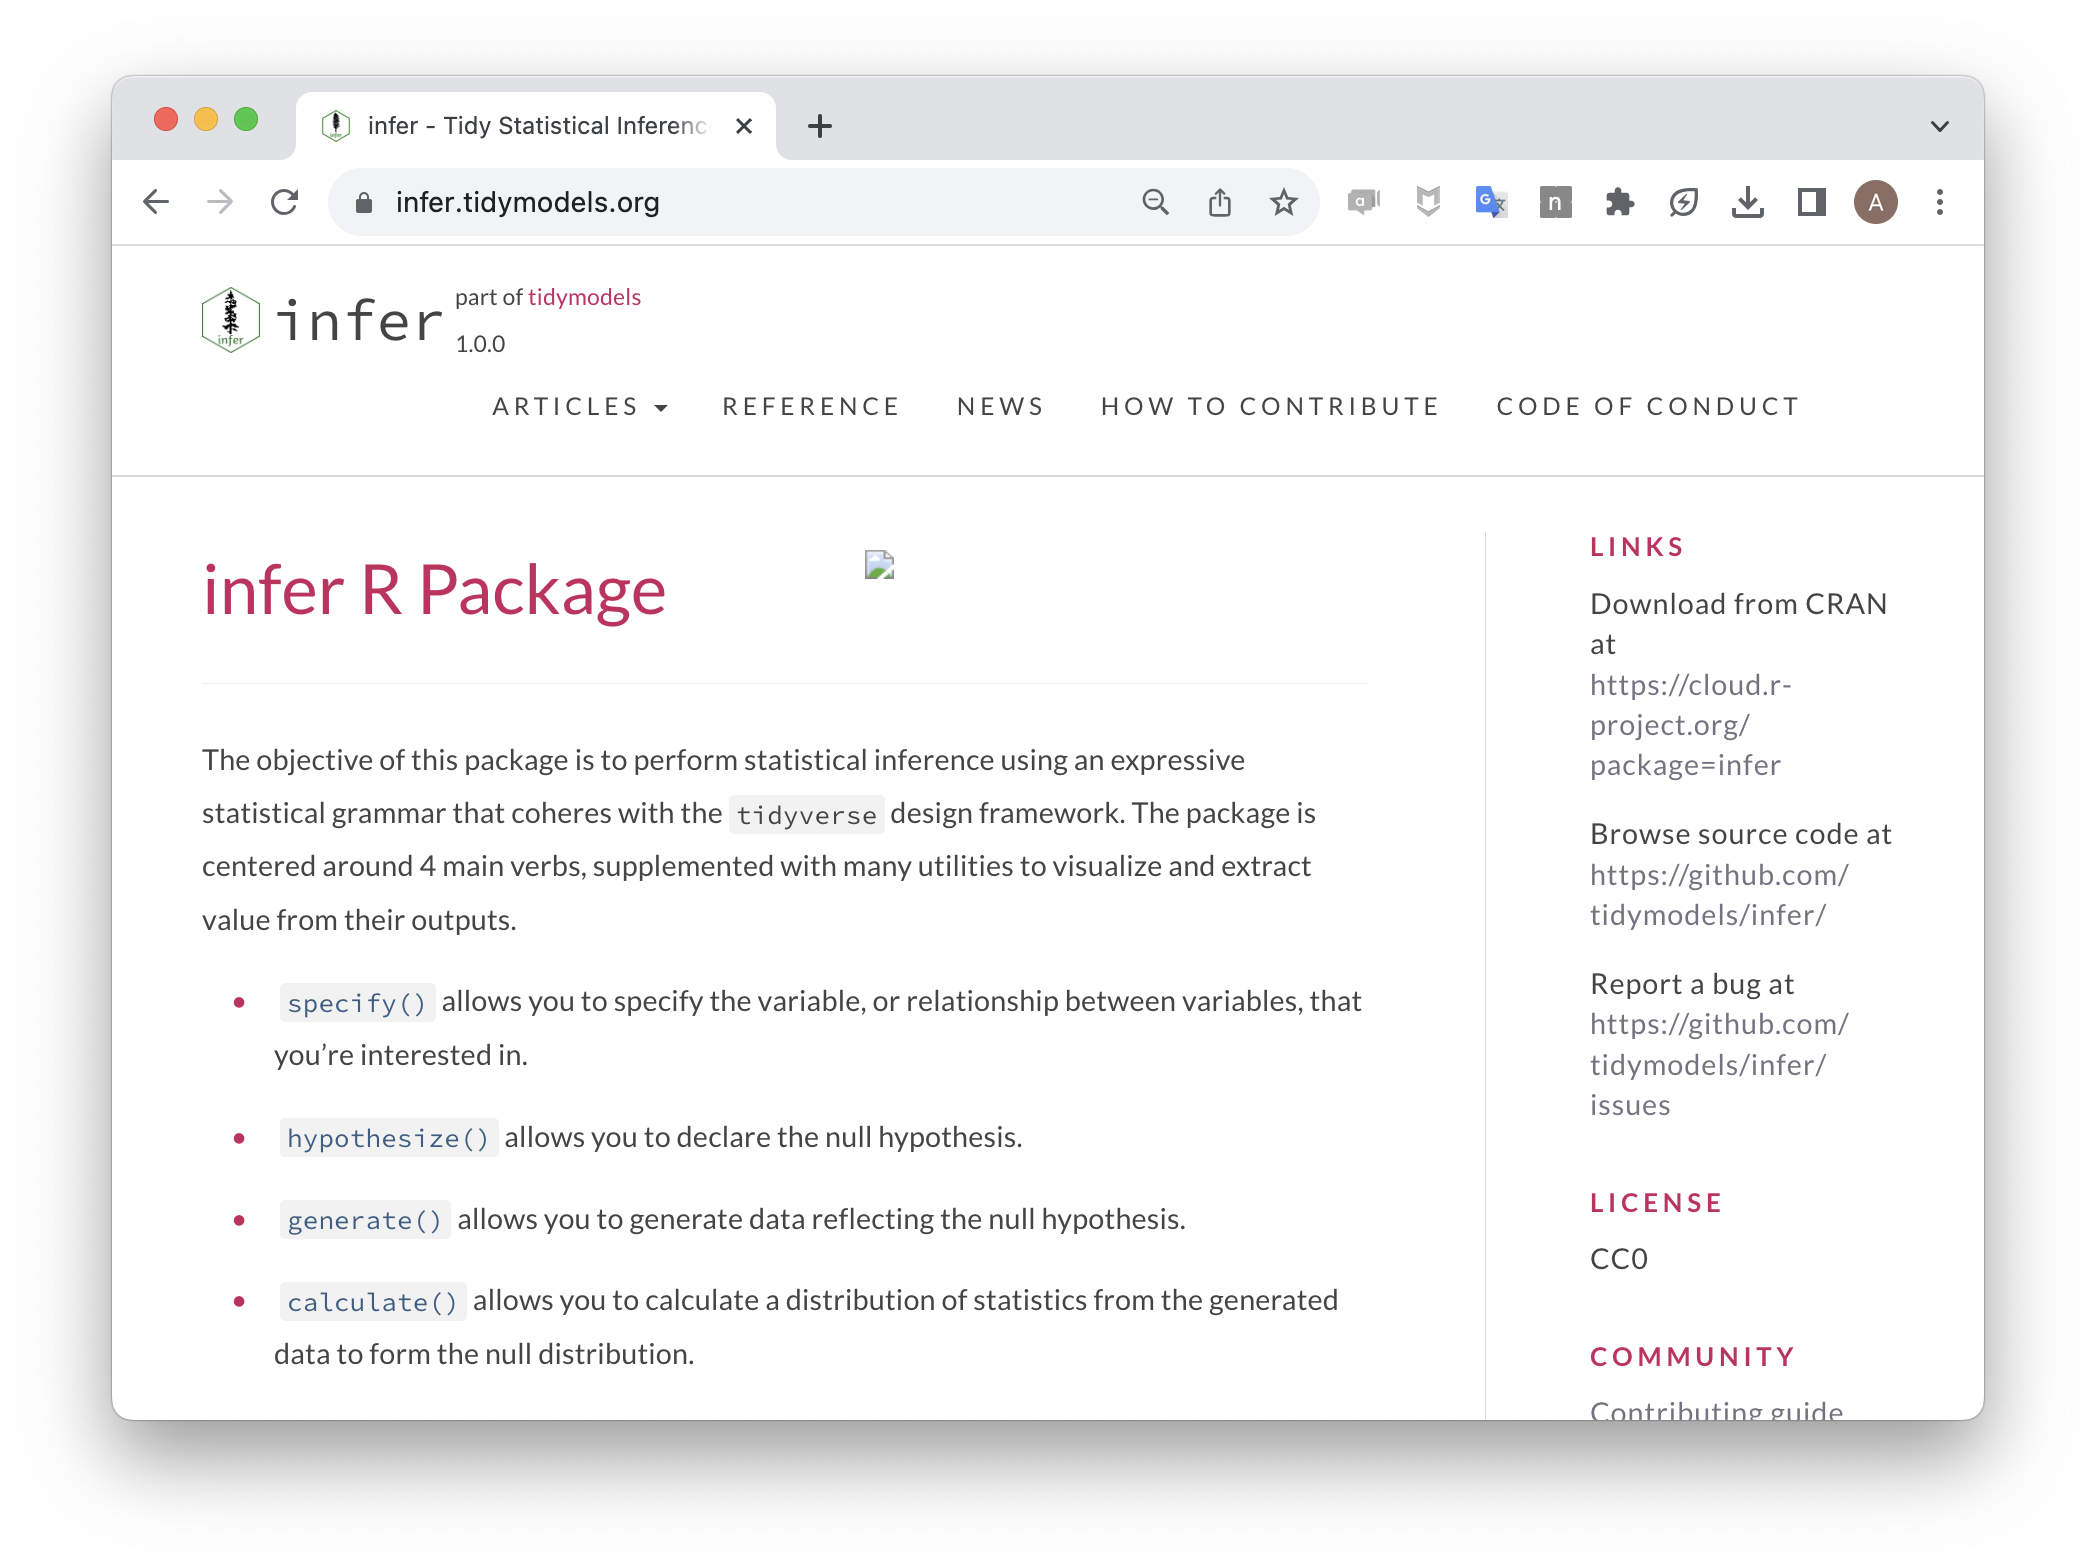
- Bootstrapping with
infer
Concept Question
Which of these is a valid bootstrap sample?
| name | species | length |
|---|---|---|
| Gus | Chinstrap | 50.7 |
| Luz | Gentoo | 48.5 |
| Ida | Chinstrap | 52.8 |
| Ola | Gentoo | 44.5 |
| Abe | Adelie | 42.0 |
| name | species | length |
|---|---|---|
| Ida | Chinstrap | 52.8 |
| Luz | Gentoo | 48.5 |
| Abe | Adelie | 42.0 |
| Ola | Gentoo | 44.5 |
| Ida | Chinstrap | 52.8 |
| name | species | length |
|---|---|---|
| Ola | Gentoo | 44.5 |
| Gus | Chinstrap | 50.7 |
| Ida | Chinstrap | 52.8 |
| Luz | Gentoo | 48.5 |
| Gus | Chinstrap | 50.7 |
| Gus | Chinstrap | 50.7 |
| name | species | length |
|---|---|---|
| Gus | Chinstrap | 50.7 |
| Ola | Gentoo | 48.5 |
| Ola | Chinstrap | 52.8 |
| Ida | Gentoo | 44.5 |
| Ida | Adelie | 42.0 |
| name | species | length |
|---|---|---|
| Gus | Chinstrap | 50.7 |
| Abe | Adelie | 42.0 |
| Gus | Chinstrap | 50.7 |
| Gus | Chinstrap | 50.7 |
| Gus | Chinstrap | 50.7 |
The Bootstrap
Parameters and Statistics
Our Goal: Assess the sampling error / variability in our estimate of the median year at Cal and the proportion of students in an econ-related field.
Our Tool: The Bootstrap
Collecting a sample of data
If you’ve been given an index card, please write on it:
- Your first name
- Your year at Cal (1 is first year, 2 is second year, etc)
- Whether or not you are interested in majoring in a business- or econ-related field. 1 = yes, 0 = no
boardwork
Problem Set
20:00
Bootstrapping with Infer
Example: Penguins
Let’s consider our 344 penguins to be a SRS from the broader population of Antarctic penguins. What is a point and interval estimate for the population proportion of penguins that are Adelie?
Point estimate
Generating one bootstrap sample
Response: is_adelie (factor)
# A tibble: 344 × 2
# Groups:   replicate [1]
   replicate is_adelie
       <int> <fct>
 1         1 FALSE
 2         1 FALSE
 3         1 TRUE
 4         1 FALSE
 5         1 TRUE
 6         1 TRUE
 7         1 FALSE
 8         1 TRUE
 9         1 TRUE
10         1 TRUE
# ℹ 334 more rows
Two more bootstrap samples
penguins |>
  specify(response = is_adelie,
          success = "TRUE") |>
  generate(reps = 1,
           type = "bootstrap")
Response: is_adelie (factor)
# A tibble: 344 × 2
# Groups: replicate [1]
replicate is_adelie
<int> <fct>
1 1 FALSE
2 1 TRUE
3 1 FALSE
4 1 FALSE
5 1 FALSE
6 1 TRUE
7 1 TRUE
8 1 FALSE
9 1 FALSE
10 1 FALSE
# ℹ 334 more rowspenguins |>
specify(response = is_adelie,
success = "TRUE") |>
generate(reps = 1,
type = "bootstrap")Response: is_adelie (factor)
# A tibble: 344 × 2
# Groups: replicate [1]
replicate is_adelie
<int> <fct>
1 1 FALSE
2 1 TRUE
3 1 TRUE
4 1 FALSE
5 1 FALSE
6 1 TRUE
7 1 TRUE
8 1 FALSE
9 1 FALSE
10 1 FALSE
# ℹ 334 more rowsVisualizing 9 bs samples
Calculating 9 \(\hat{p}\)
Response: is_adelie (factor)
# A tibble: 9 × 2
  replicate  stat
      <int> <dbl>
1         1 0.404
2         2 0.430
3         3 0.404
4         4 0.433
5         5 0.468
6         6 0.448
7         7 0.427
8         8 0.413
9         9 0.474
Note the change in data frame size.
The bootstrap dist (reps = 500)
Interval Estimate
We can extract the middle 95% by identifying the .025 quantile and the .975 quantile of the bootstrap distribution with get_ci().
# A tibble: 1 × 2
  lower_ci upper_ci
     <dbl>    <dbl>
1    0.392    0.494
Documentation: infer.tidymodels.org

Your Turn
Create a 95% confidence interval for the median bill length of penguins.
05:00


