What will this line of code return?
Respond at pollev.com
.
01:00
In R, this evaluation happens element-wise when operating on vectors.
[1] TRUE TRUE FALSE
[1] FALSE FALSE TRUE
[1] TRUE TRUE FALSE
Which observations will be included in the following data frame?
Please respond at pollev.com
.
01:00
Do you think students in their first semester would be more likely or less likely to think we would remain in remote learning for the entire semester?
Answer at pollev.com
.
Which data frame will have fewer rows?
How do we extract the average of these students’ chance that class will be disrupted by a new COVID variant?
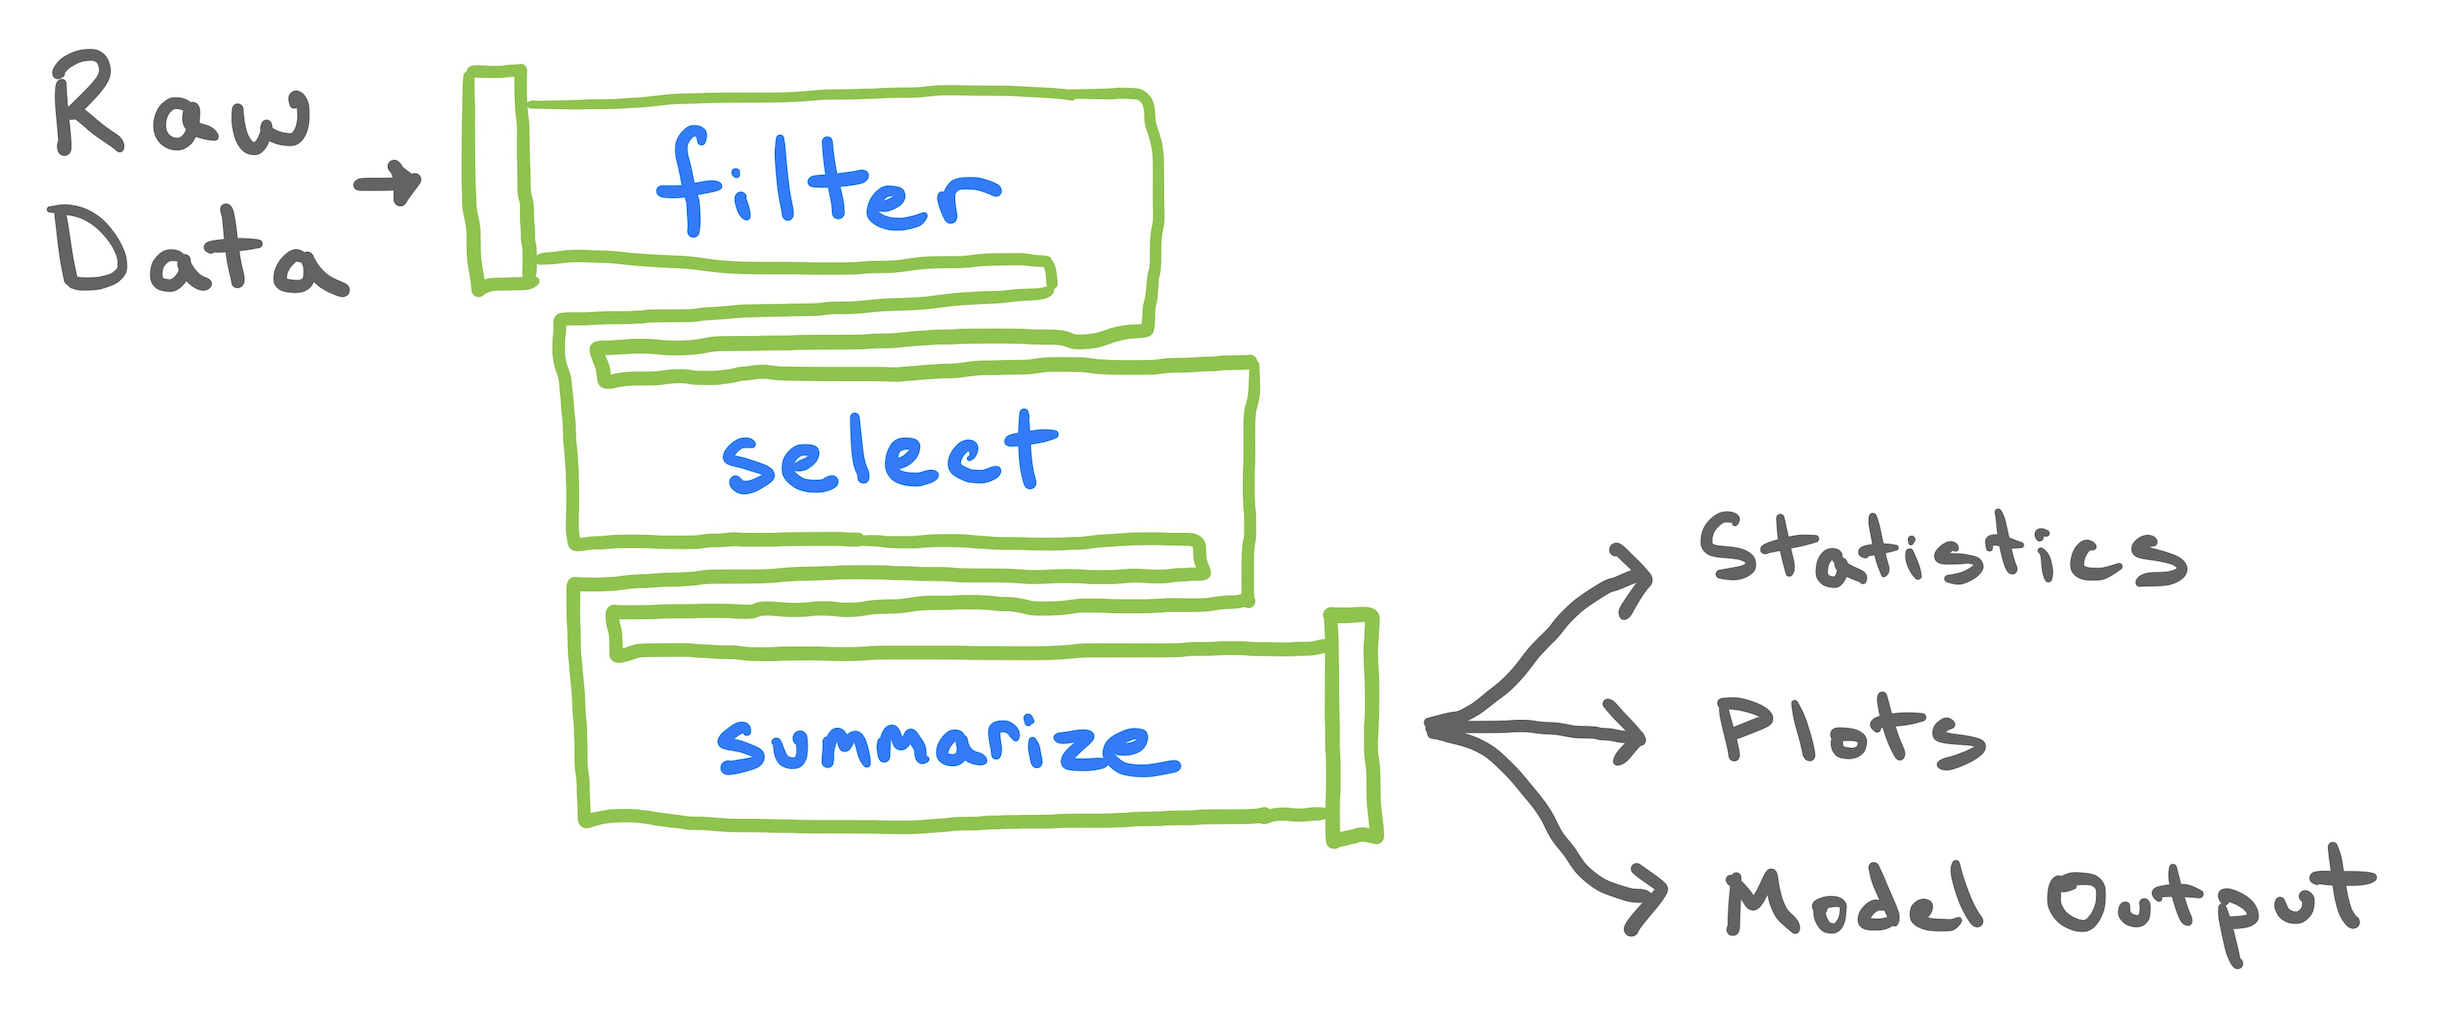
Most claims about data start with a raw data set, undergo many subsetting, aggregating, and cleaning operations, then return a data product.
Let’s look at three equivalent ways to build a pipeline
Cons
Pros
Cons
Pros
Cons
Pros
It’s good practice to understand the output of each line of code by breaking the pipe.
What are the dimensions (rows x columns) of the data frames output at each stage of this pipe?
01:00
Do you think first year students would be more likely or less likely to think we would remain in remote learning for the entire semester?
Which commands are needed to help answer this question?
new_COVID_variant
Aside: density plot
new_COVID_variant
summarize(class_survey,
mean = mean(new_COVID_variant),
med = median(new_COVID_variant),
iqr = IQR(new_COVID_variant),
sd = sd(new_COVID_variant))
# A tibble: 1 × 4
mean med iqr sd
<dbl> <dbl> <dbl> <dbl>
1 0.368 0.3 0.35 0.468
The distribution of probabilities of all students is right-skewed with a mean probability of 0.37 and a median probability of 0.3, an IQR of 0.35 and a SD of 0.47.
How can we focus our analysis on just first year students?
General goal: Identify whether the value in a variable meets a condition.
Here: Is the value in
new_COVID_variant
equal to"I'm in my first year."
?
Our Tool, Comparison operators: A collection of operators that compare two values / vectors and return TRUE
or FALSE
.
[1] FALSE
[1] TRUE
[1] FALSE
==
evaluates equality,!=
evaluates inequality.
# A tibble: 619 × 3
year new_COVID_variant first_year
<chr> <dbl> <lgl>
1 I'm in my second year. 0.25 FALSE
2 This is my first semester! 0.1 FALSE
3 This is my first semester! 0 FALSE
4 I'm in my second year. 0.2 FALSE
5 I'm in my first year. 0.9 TRUE
6 I'm in my second year. 0.2 FALSE
7 I'm in my second year. 0.4 FALSE
8 I'm in my second year. 0 FALSE
9 I'm in my second year. 0.2 FALSE
10 I'm in my first year. 0.3 TRUE
# ℹ 609 more rows
# A tibble: 245 × 3
year new_COVID_variant first_year
<chr> <dbl> <lgl>
1 I'm in my first year. 0.9 TRUE
2 I'm in my first year. 0.3 TRUE
3 I'm in my first year. 0.6 TRUE
4 I'm in my first year. 0.3 TRUE
5 I'm in my first year. 0.3 TRUE
6 I'm in my first year. 0.1 TRUE
7 I'm in my first year. 0.7 TRUE
8 I'm in my first year. 0.2 TRUE
9 I'm in my first year. 0.5 TRUE
10 I'm in my first year. 0.5 TRUE
# ℹ 235 more rows
new_COVID_variant
with statisticsStatistics from all students
summarize(class_survey,
mean = mean(new_COVID_variant),
med = median(new_COVID_variant),
iqr = IQR(new_COVID_variant),
sd = sd(new_COVID_variant))
# A tibble: 1 × 4
mean med iqr sd
<dbl> <dbl> <dbl> <dbl>
1 0.368 0.3 0.35 0.468
Statistics from first year students
new_COVID_variant
with graphicsHistogram for all students
Histograms from first year and non-first year students
What is the mean probability of
new_COVID_variant
for students who were very confident that we could engineer our way out of the effects of climate change (6 or above onclimate_change
)?
# A tibble: 619 × 3
year new_COVID_variant first_year
<chr> <dbl> <lgl>
1 I'm in my second year. 0.25 FALSE
2 This is my first semester! 0.1 FALSE
3 This is my first semester! 0 FALSE
4 I'm in my second year. 0.2 FALSE
5 I'm in my first year. 0.9 TRUE
6 I'm in my second year. 0.2 FALSE
7 I'm in my second year. 0.4 FALSE
8 I'm in my second year. 0 FALSE
9 I'm in my second year. 0.2 FALSE
10 I'm in my first year. 0.3 TRUE
# ℹ 609 more rows
# A tibble: 1 × 1
`mean(new_COVID_variant)`
<dbl>
1 0.368
What is the mean probability of
new_COVID_variant
for first-year students who were very confident that we could engineer our way out of the effects of climate change (6 or above onclimate_change
)?
# A tibble: 1 × 1
`mean(new_COVID_variant)`
<dbl>
1 0.370
filter()
separated by commas.What else can logical vectors be used for?
What is will this line of code return?
Respond at pollev.com
.
Logical vectors have a dual representation as TRUE
FALSE
and 1
, 0
, so you can do math on logicals accordingly.
Taking the mean of a logical vector is equivalent to find the proportion of rows that are
TRUE
(i.e. the proportion of rows that meet the condition).
25:00