01:00
Summarizing Numerical Data
STAT 20: Introduction to Probability and Statistics
Agenda
- Announcements
- Concept Questions and Activity
- Problem Set 3
- Break
- Coding Refresher
- Lab 1.2: Computing on the Data
Announcements
- RQ: Data Pipelines released Friday afternoon and due Monday at 11:59pm
- Problem Sets 2 (Tue/Wed) and 3 (today) due Tuesday at 9am
- Lab 1: Class Survey (both parts) due Tuesday at 9am
- Group Tutoring Sessions started yesterday in Evans Hall!
- We slightly changed Problem 7, Lab 1.1
Concept Question
Describing Shape
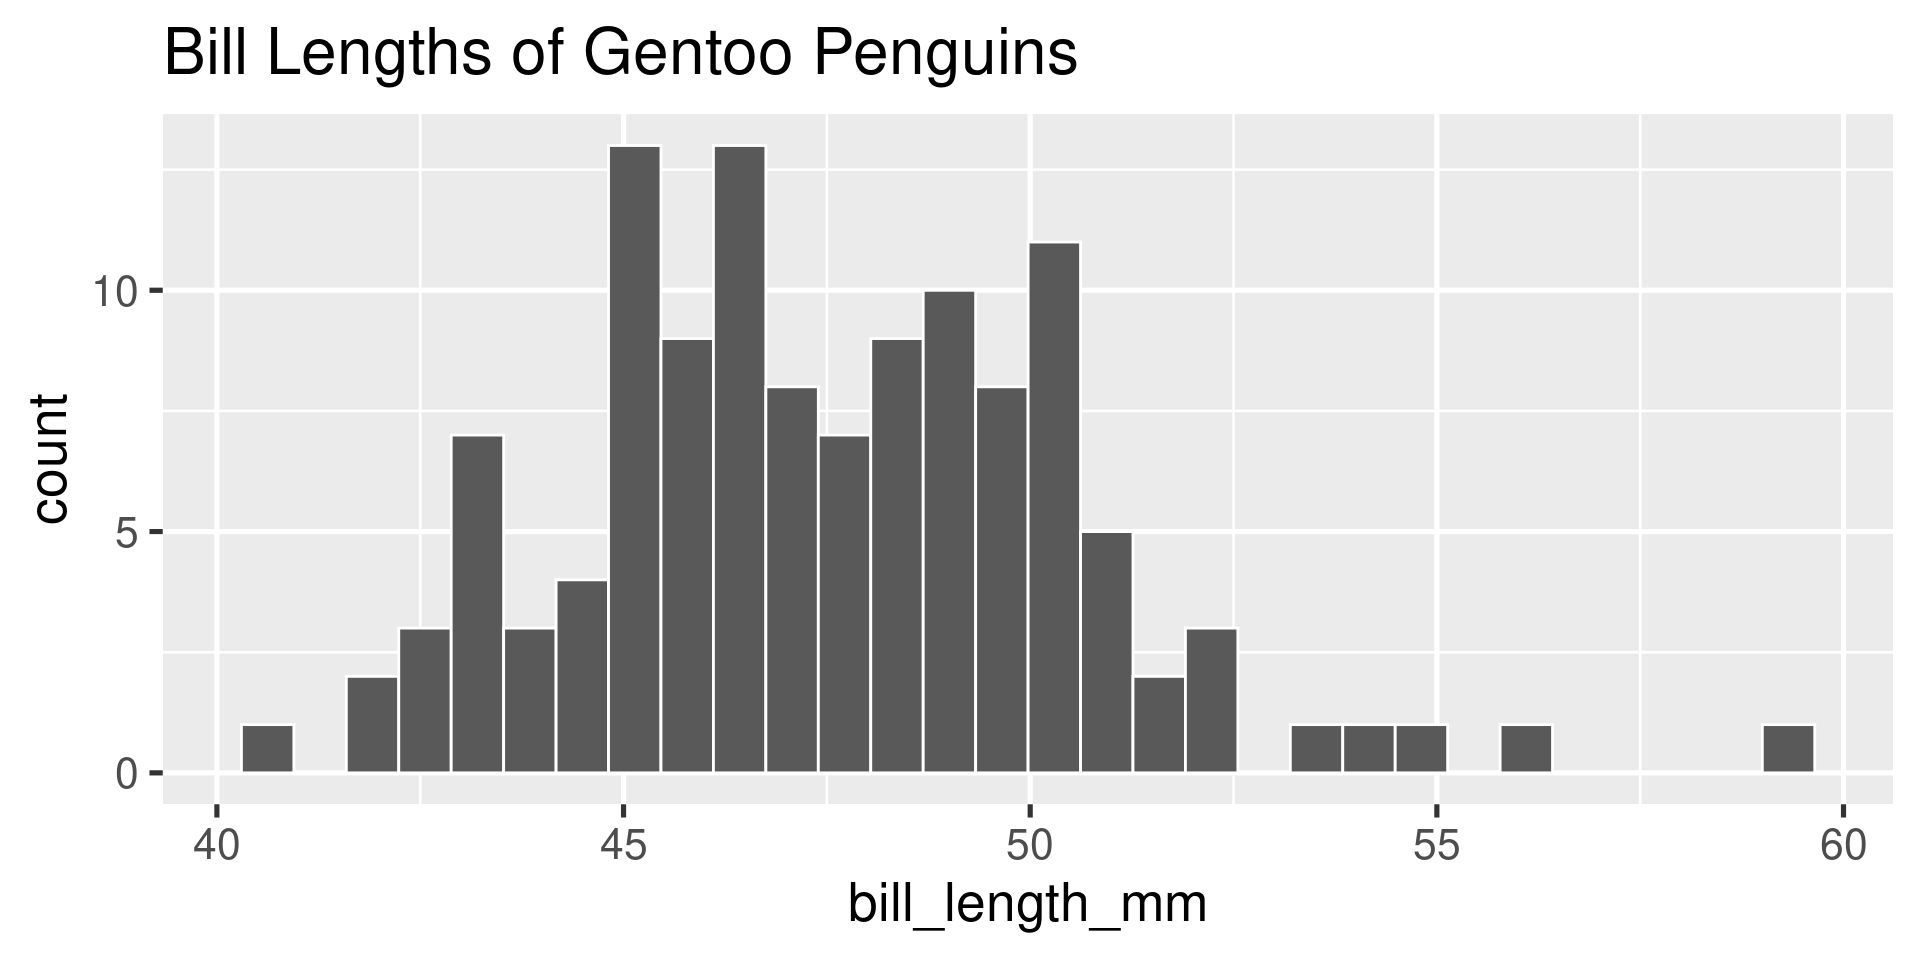
Which of these variables do you expect to be uniformly distributed?
- bill length of Gentoo penguins
- salaries of a random sample of people from California
- house sale prices in San Francisco
- birthdays of classmates (day of the month)
Please vote at pollev.com.
Concept Activity - Measures of Center
Mean, median, mode: which is best?
It depends on your desiderata: the nature of your data and what you seek to capture in your summary.
Get out a piece of paper. You’ll be watching a 3 minute video that discusses characteristics of a typical human. Note which numerical summaries are used and what for.
General Advice
- Means are often a good default for symmetric data.
- Means are sensitive to very large and small values, so can be deceptive on skewed data. > Use a median
- Modes are often the only option for categorical data.
But there are other notions of typical… what about a maximum?
Concept Question 3 - Measures of Spread
- Why are measures of spread so important? Consider the following question.
There are two new food delivery services that open in Berkeley: Oski Eats and Cal Cravings. A friend of yours that took Stat 20 collected data on each and noted that Oski Eats has a mean delivery time of 29 minutes and Cal Cravings a mean delivery time of 27 minutes. Which would would you rather order from?
- Discuss this question with your classmates! (no poll question).
01:00
One possible reality
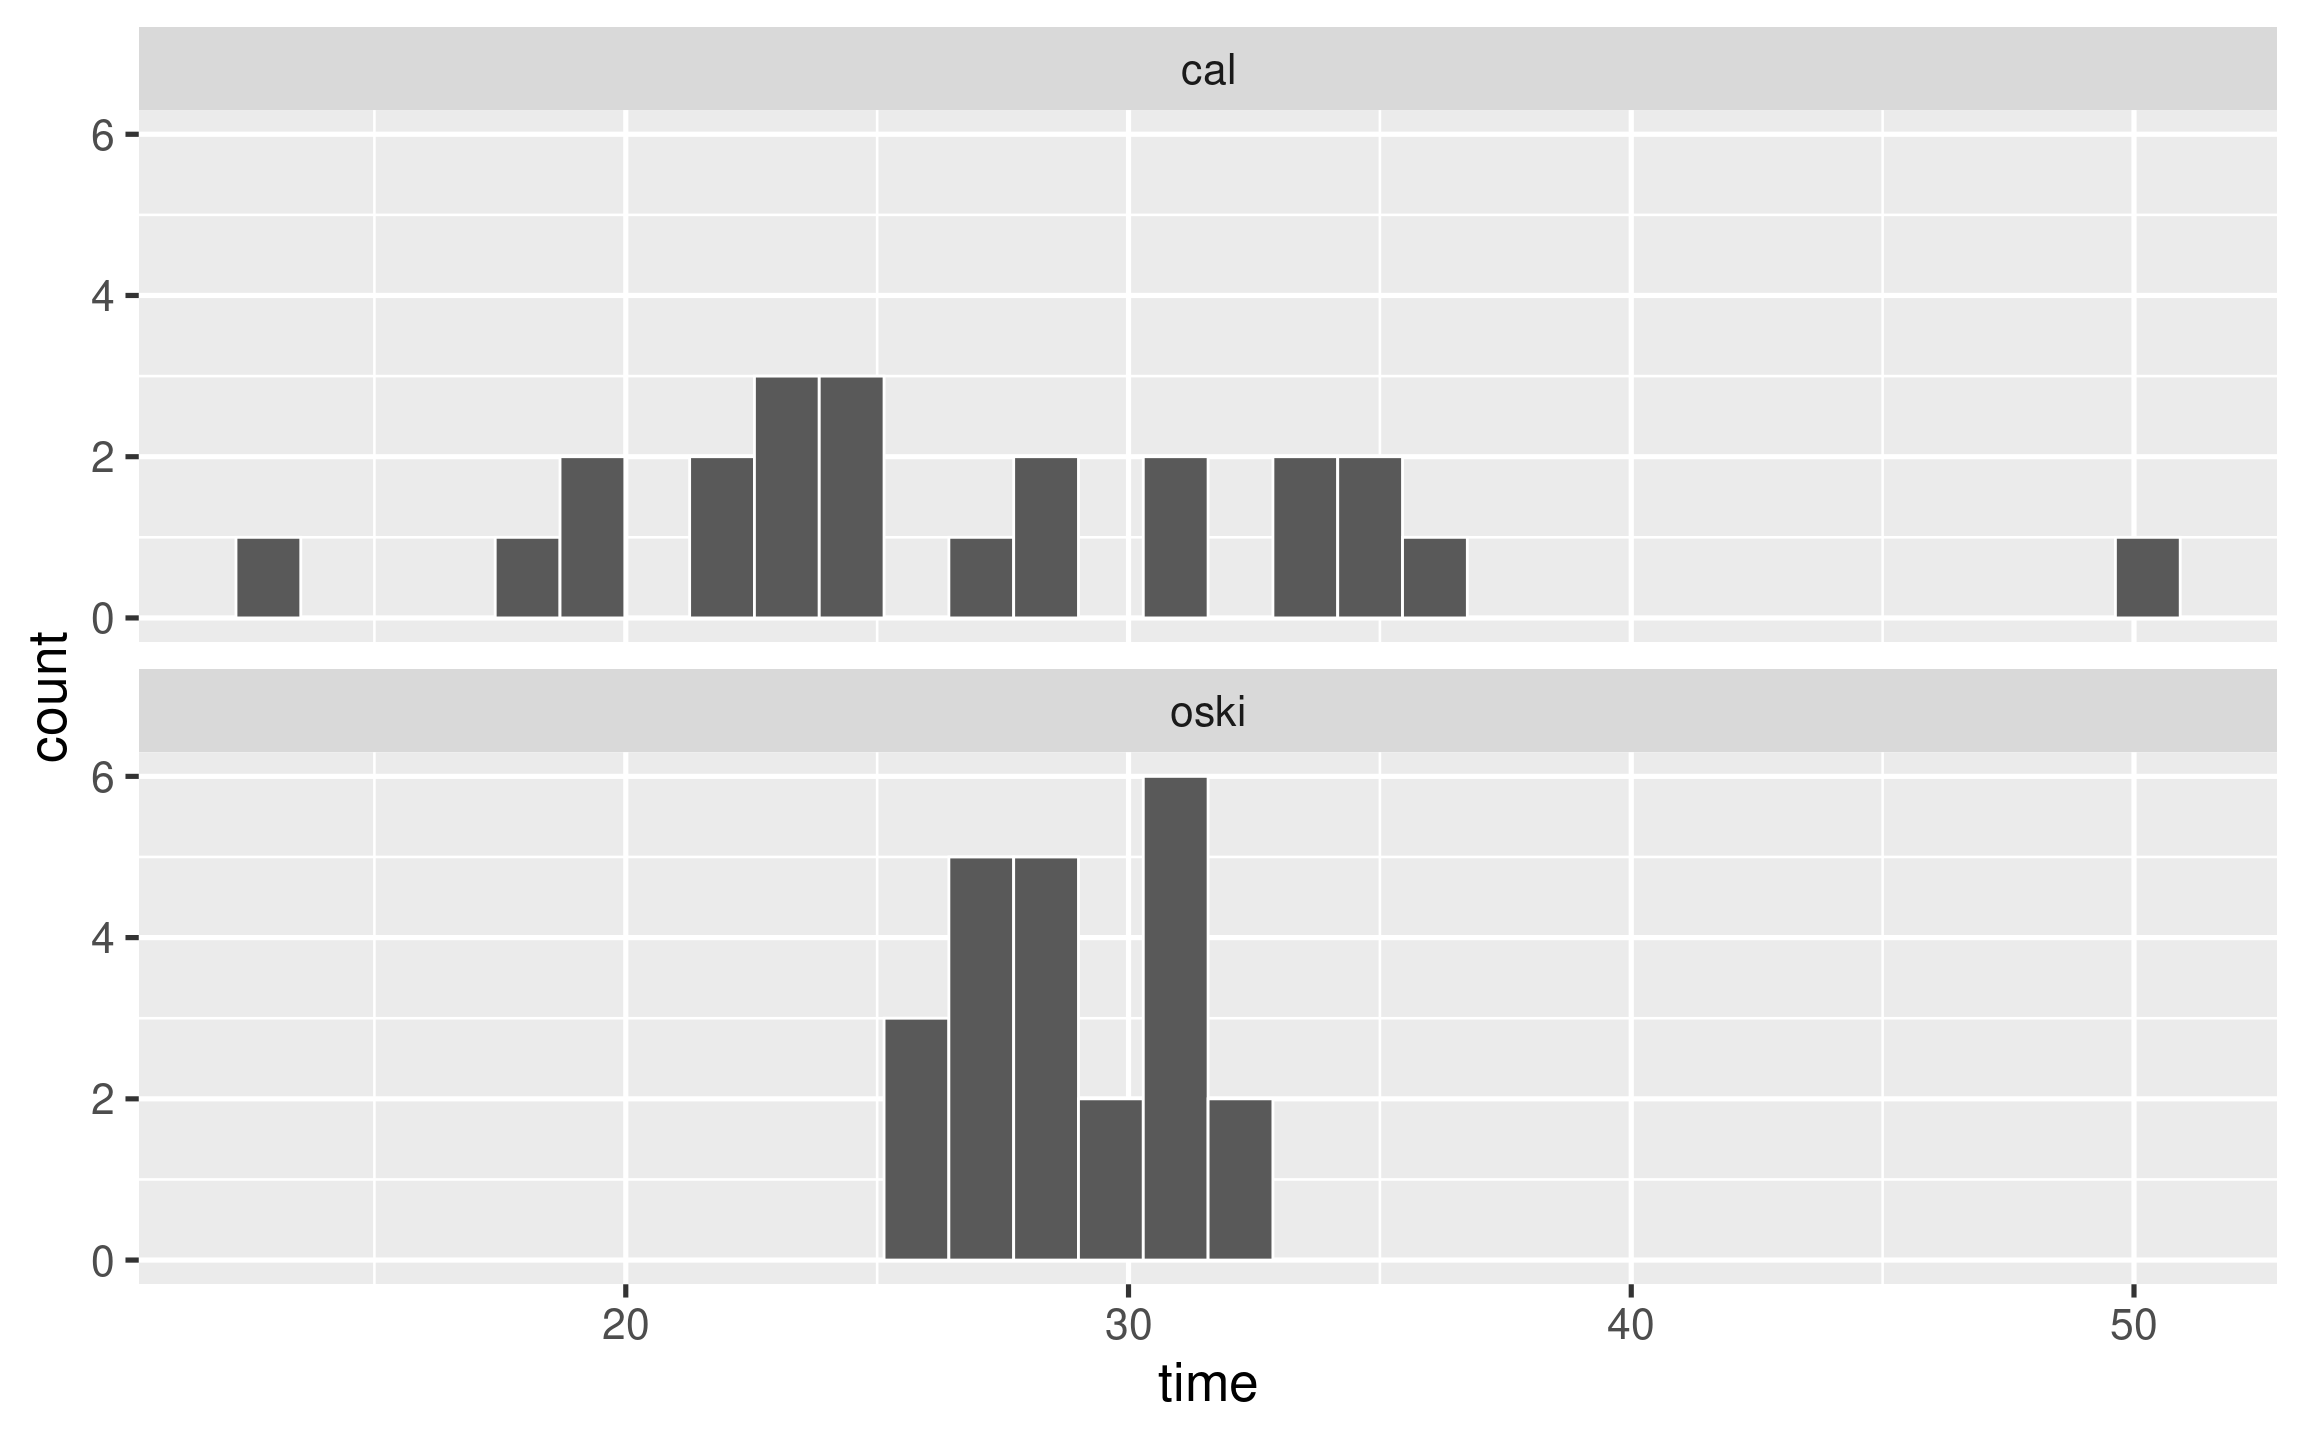

Would you still prefer to order from Cal?
Problem Set 3: Summarizing Numerical Data
Work on the problem set in groups of 2. We will discuss some questions toward the end of the period!
25:00
Break
05:00
Coding Refresher
Head to PollEverywhere for a competition!
Lab 1.2 - Computing on the Data
Work on the lab. We will discuss some questions toward the end of the period!
30:00