00:30
Summarizing Categorical Data
STAT 20: Introduction to Probability and Statistics
Agenda
- Announcements
- Concept Questions
- Problem Set 2: Summarizing Categorical Data
- Break
- Introducing Lab 1
- Work time for Lab 1: Understanding Context
Announcements
- RQ: Summarizing Numerical Data due Wednesday at 11:59pm on Gradescope.
- Quiz 1 next Monday, January 29th in-class. Topics covered:
- Understanding the World with Data
- Taxonomy of Data
- Summarizing Categorical Data (today)
- Summarizing Numerical Data (next class)
- Lab 1 (Class Survey) due Tuesday, January 29th at 9am on Gradescope. Make sure you read the Lab Submission Guidelines posted to Ed!
- Problem Set 2 due Tuesday, January 29th at 9am on Gradescope
Concept Questions
Concept Question 1
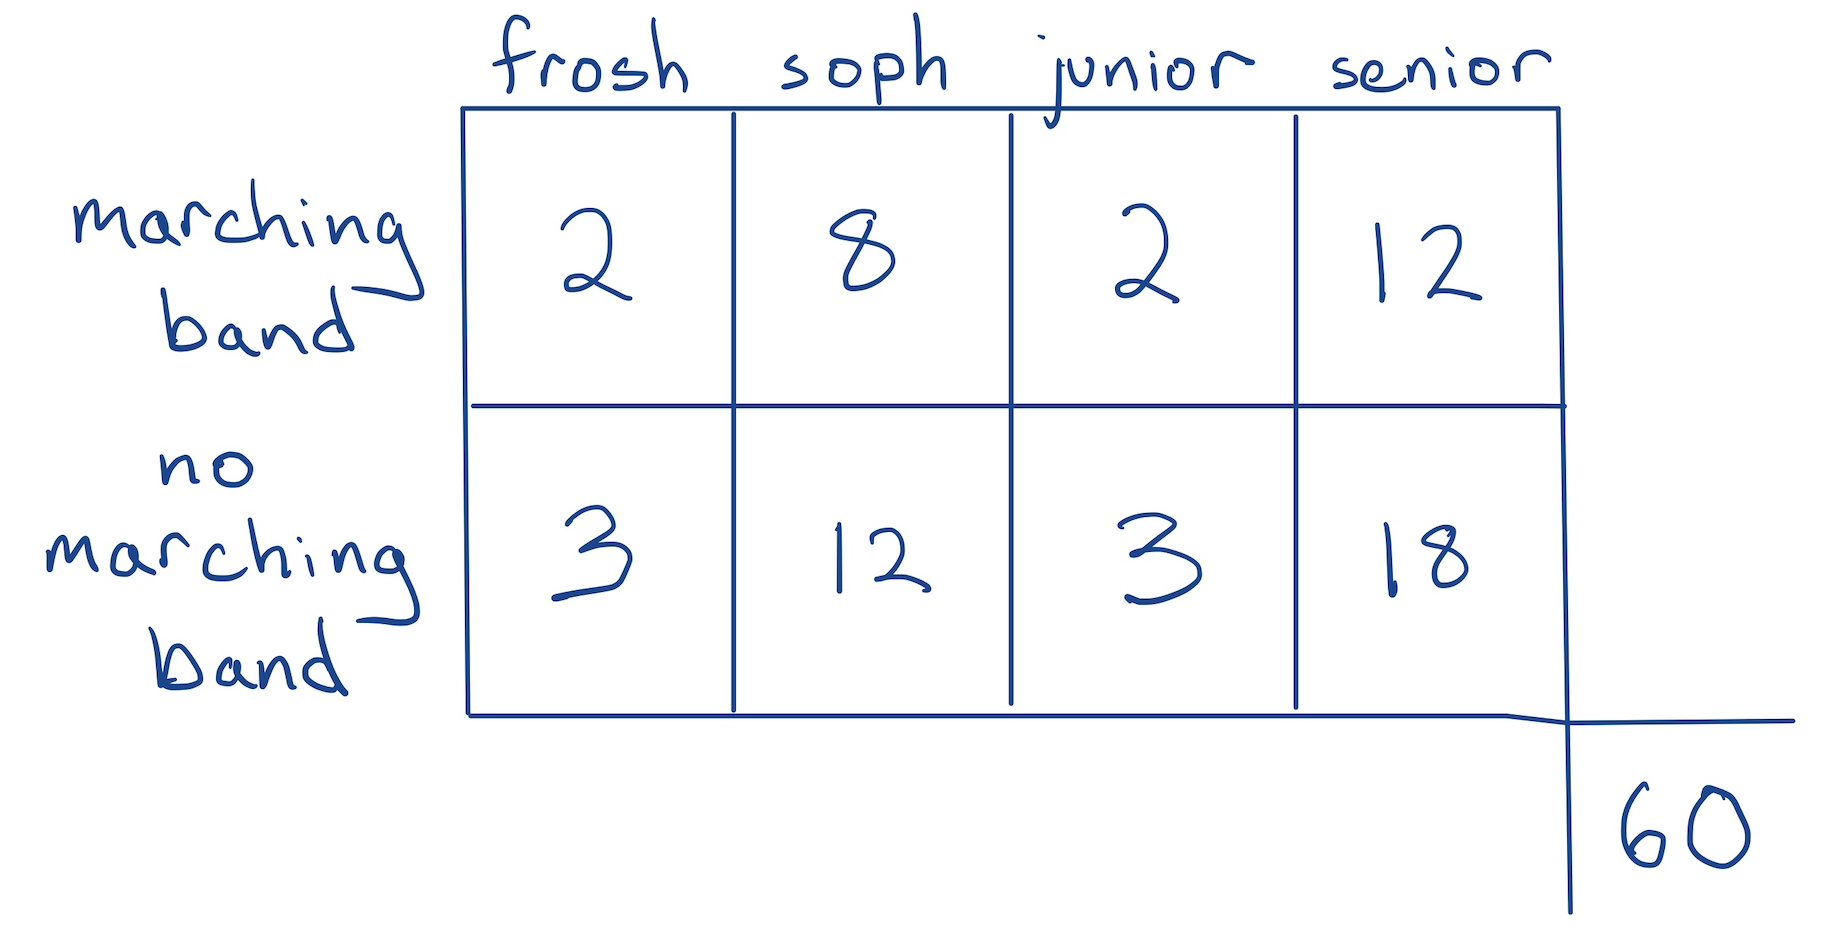
- The next four subquestions are based on the same table.
The table below displays data from a survey on a class of students.

What proportion of the class was in the marching band?

What proportion of those in the marching band where juniors?
00:30

What proportion were sophomores not in the marching band?
00:30

What were the dimensions of the raw data from which this table was constructed?
00:30

How would you characterize the association between these two variables?
00:30
Concept Question 2
Political affiliation and college degree status of 500 survey participants.

Which group is the largest?
01:00
Concept Question 3
What does this plot show?
01:00
Problem Set 2: Summarizing Categorical Data
25:00
Break
05:00
Introducing Lab 1
Let’s visit the lab slides, which are available on stat20.org!
Lab 1: Understanding the Context of The Data
25:00