Code
Code
Which of the following is FALSE regarding a contingency table?
( ) It has the levels of one variable along the top of the columns and the levels of a second variable down the left side of the rows. ( ) It displays the counts that occur in every combination of levels of two categorical variables. ( ) They are used to summarize the information found in a data frame. (X) They are interchangable with a data frame.
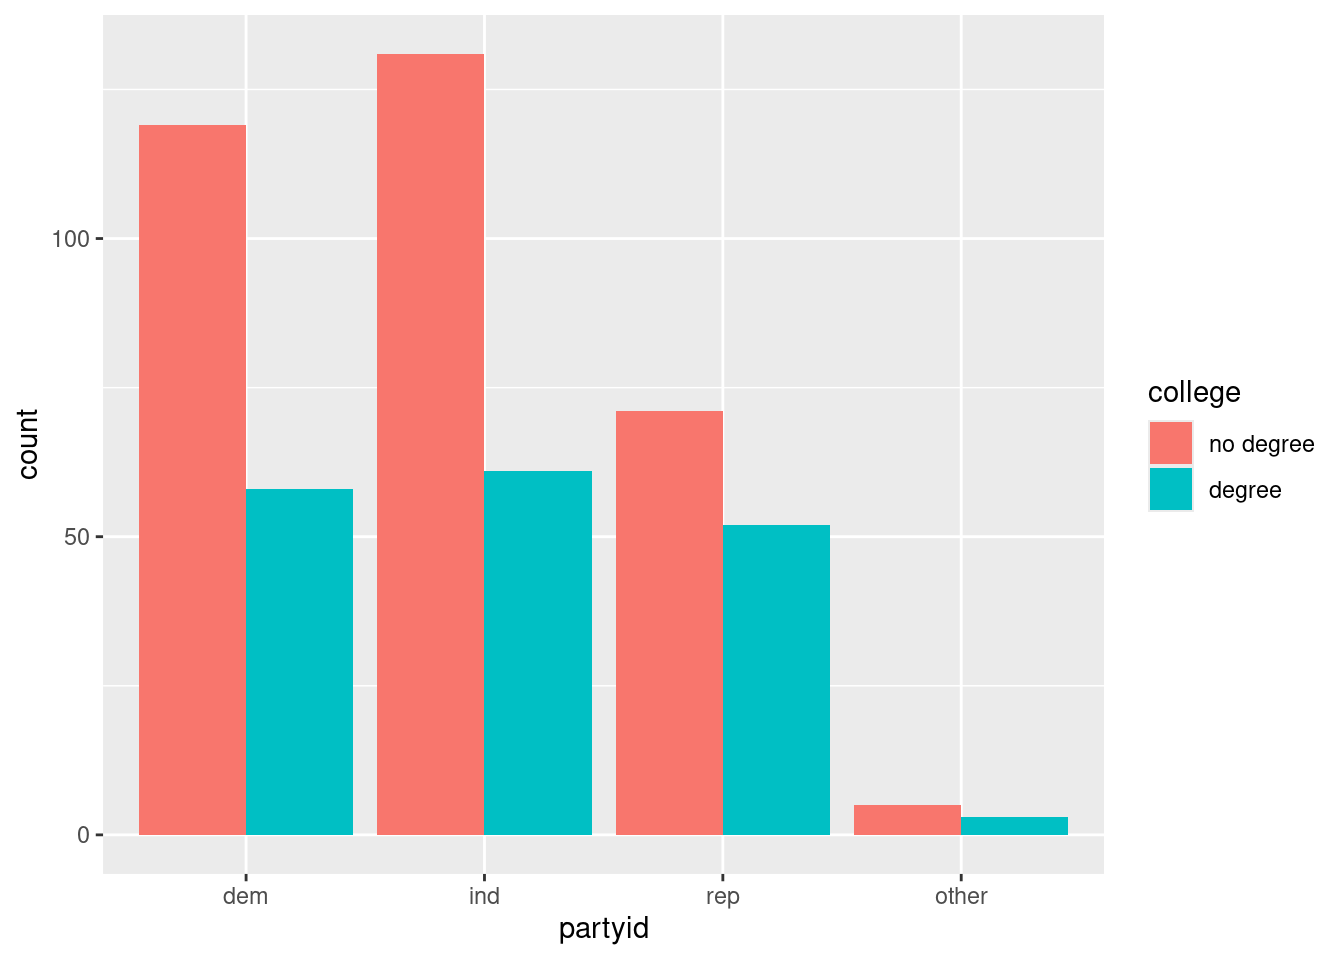
The following questions deal with data from the General Social Survey that takes a representative sample of Americans and asks them a range of questions about their opinions and lifestyle. One of the questions asked about whether they had a college degree or not. The other asked the political party that they identify with: dem (democrat), ind (independent), rep (republican), or other.
What was the most frequently cited party that respondents identified with?
( ) dem (X) ind ( ) rep ( ) other ( ) no degree ( ) degree
True or False: most of the survey respondents had a college degree.
( ) True (X) False
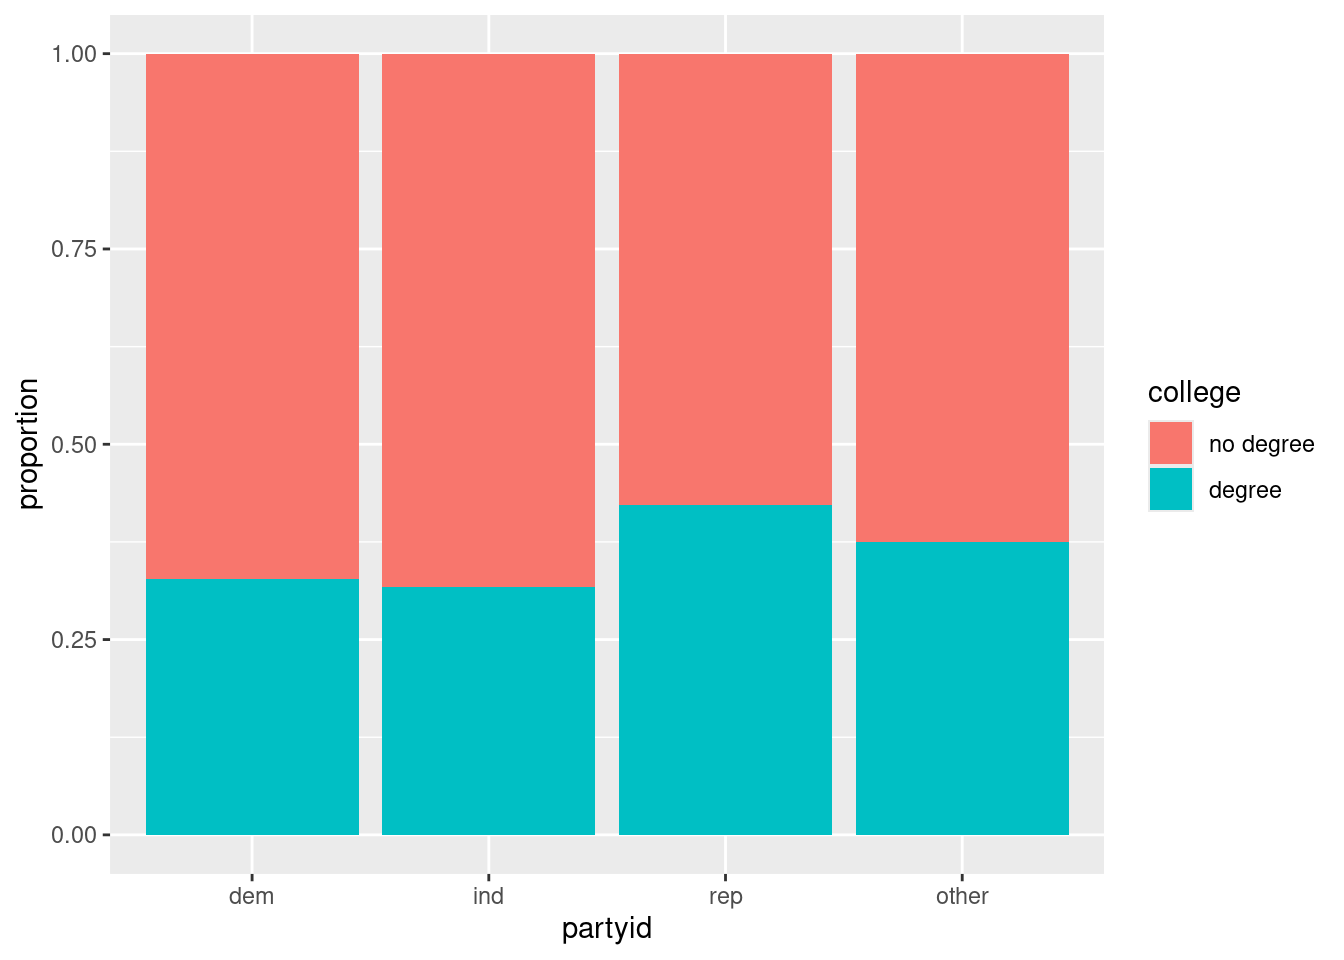
The same data can be re-expressed as a normalized stacked bar chart.
Which of the following statements is True?